

Pollution and Race
A Study of Mecklenburg County, NC
“Water and air, the two essential fluids on which all life depends, have become global garbage cans”
“There’s one thing you can say for air pollution, you get utterly amazing sunrises”
Air pollution is any chemical, physical or biological agent that modifies the characteristics of the atmosphere. Not only can it cause respiratory and other diseases, pollution is closely linked to the earth’s climate and global ecosystems. Data from the World Health Organization show that almost all of the global population (99%) breathe air that contains high levels of pollutants, and that low- and middle-income countries suffer from the highest exposures.
Rather than looking at the world as a whole, lets see how that plays out at the local level, in a single county in one of the richest countries on the planet.
Mecklenburg County, NC
Mecklenburg County is a county located in the southwestern region of North Carolina. Of the county’s seven municipalities, the city of Charlotte is the largest community in the state. With a population of 1,115,482 (as of the 2020 census) Mecklenburg is one of the most populated counties in North Carolina, second only to Wake County. Additionally, the county was the first in the Carolinas to surpass 1 million people.
Ample transportation access is just one reason that has led ten of the state’s thirteen Fortune 500 companies have choose the county for their headquarters. With industries ranging from banking to manufacturing, jobs are a major draw to Mecklenburg county.
Population
Mecklenburg County is a majority non-white county, with the white population making up only 45% of the whole, although no other race has a plurality. For simplicity, only these two categories will be compared.
The US Census Bureau breaks population metrics down to regions called census tracts. These are small, relatively permanent statistical subdivision of a county, averaging approximately 4,000 inhabitants, although can be anywhere in the 1,200 and 8,000 range. This allows for the identification of predominately white or non-white areas within the county.
Pollution
Part 1: Toxic Release Inventory
The Toxic Release Inventory (TRI) is an EPA management tool used to track chemicals that may pose a threat to human health and the environment, as reported by US facilities that use any of the 770 listed chemicals in amounts above required levels.
The tables below list the county’s 36 highest releasing companies, as reported by the TRI.
| COMPANY | LBS RELEASED | INDUSTRY |
|---|---|---|
| PEPPERIDGE FARM INC | 119,014.00 | Food |
| CHARLOTTE PIPE & FOUNDRY CO | 61,371.50 | Primary Metals |
| MALLARD CREEK POLYMERS | 36,710.99 | Chemicals |
| AMERICH CORP | 20,811.71 | Plastics and Rubber |
| IGM SPECIALTIES HOLDING INC | 15,199.43 | Chemicals |
| BRENNTAG NORTH AMERICA INC | 6,874.00 | Chemical Wholesalers |
| UNIVAR SOLUTIONS USA INC | 5,714.09 | Chemical Wholesalers |
| KURZ TRANSFER PRODUCTS LP | 5,688.00 | Printing |
| GERDAU USA INC | 4,503.42 | Primary Metals |
| JIM MYERS & SONS INC | 2,855.66 | Fabricated Metals |
| SIEMENS ENERGY INC | 2,052.02 | Machinery |
| COMMERCIAL MERCHANDISING CORP | 2,010.00 | Chemicals |
| QUANTUM COATINGS INC | 1,500.00 | Chemicals |
| ARAMCO SERVICES CO | 1,088.00 | Petroleum Bulk Terminals |
| MARATHON PETROLEUM CORP | 775 | Petroleum Bulk Terminals |
| STEELFAB INC | 542.11 | Fabricated Metals |
| TRANSCONTINENTAL PACKAGING INC | 441.7 | Plastics and Rubber |
| SOTERA HEALTH LLC | 286 | Other |
| COMPANY | LBS RELEASED | INDUSTRY |
|---|---|---|
| BRADDOCK METALLURGICAL | 279 | Fabricated Metals |
| INX INTERNATIONAL INK CO | 73.19 | Chemicals |
| ILLINOIS TOOL WORKS INC | 65 | Fabricated Metals |
| VERITIV OPERATING CO | 65 | Other |
| COLONIAL GROUP INC | 29.9 | Chemical Wholesalers |
| THE SHERWIN-WILLIAMS CO | 17 | Chemicals |
| CLEAN HARBORS INC | 13.19 | Hazardous Waste |
| DYSTAR LP | 10.44 | Chemicals |
| FIRST SOURCE WORLDWIDE LLC | 10 | Chemical Wholesalers |
| HARPER CORP OF AMERICA | 6.46 | Machinery |
| AMETEK INC | 6.34 | Fabricated Metals |
| SOUTHWIRE CO | 4 | Electrical Equipment |
| FXI INC | 3.2 | Plastics and Rubber |
| MEXICHEM SPECIALTY COMPOUNDS INC | 2.61 | Chemicals |
| MASONITE CORP | 2.5 | Fabricated Metals |
| VINCI CONSTRUCTION | 1.6 | Petroleum |
| TRANE TECHNOLOGIES CO LLC | 1.1 | Machinery |
| ARGOS USA CORP | 0.35 | Nonmetallic Mineral Product |
While 36 companies might seem like a lot, take note of the following:
17 of 36 companies report less than 100 lbs released
22 of 36 companies report less than 1,000 lbs released
30 of 36 companies report less than 10,000 lbs released
The highest releasing company reports twice that of the second highest company
Plotting the locations of each of these facilities on a map reveals a small cluster and large scattered cluster in the south western and central areas of the county, respectively.
Summarizing the locations with their associated census tracts, and comparing that with the population distributions highlights those tracts that are both highly polluted and have a high non-white population.
This can be further analyzed in the below table.
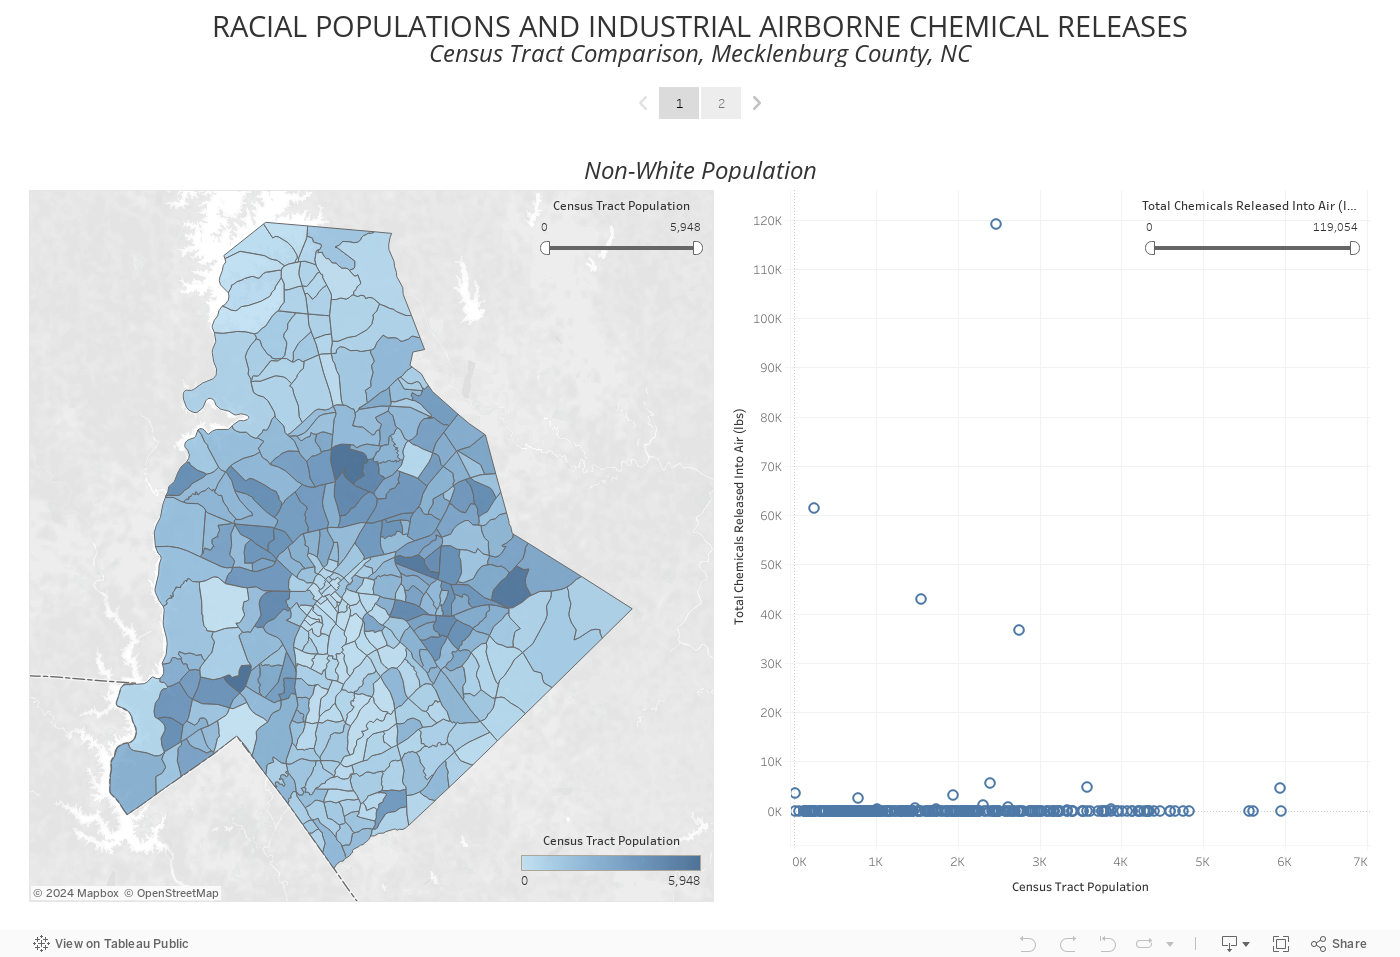
Conclusions
By adjusting the sliders in the interactive tool above, the it’s clear that there is relationship between polluting facilities and racial groups. A facility that releases chemicals listed on the TRI are more likely to be in a locations with a higher non-white population.
Of course that result might be expected, considering that a majority of the county is non-white. As a result, an additional study is needed to break down the populations into individual racial groups to determine if any one group is more impacted than another.
Additionally, since a small handful of facilities has the potential to drastically skew the data, analyzing a truncated set of facilities might make it easer to determine a more accurate trend.